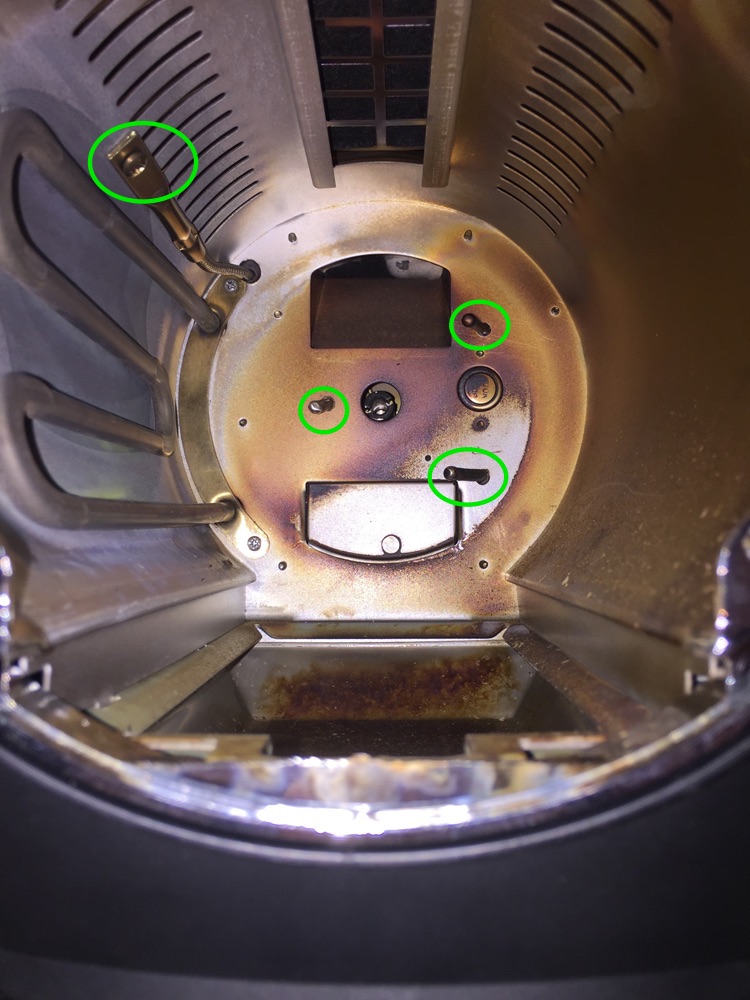
One of the recent upgrades I made to my HotTop roaster was to add two additional thermocouples in an attempt to collect more data from the machine. One of the probes I added was a second environment temp (ET) probe to see what the difference is in temperatures at different locations within the drum and to my surprise, there is very little difference between the two; on average 4°F.

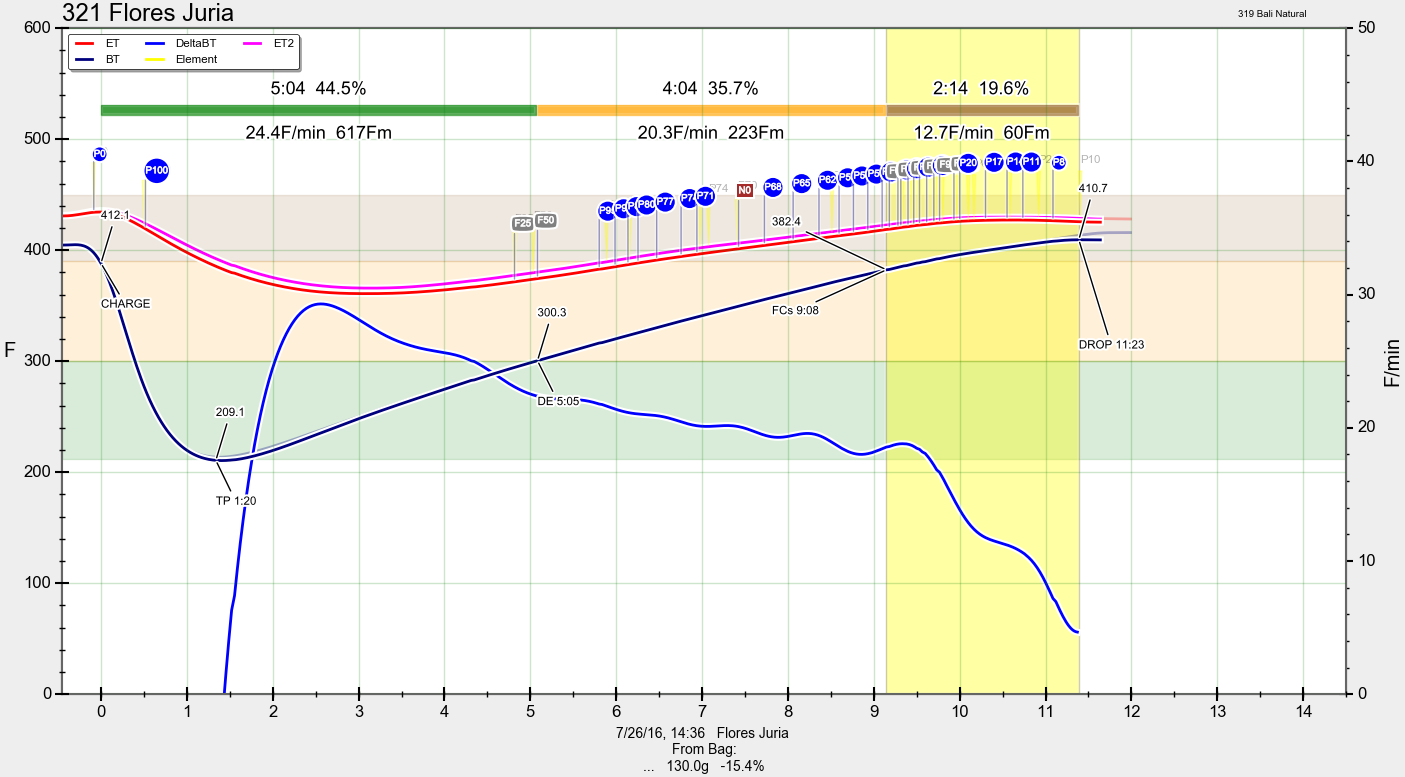
Even more interesting, is that with increasing fan power, the two begin to converge, which makes sense: with more airflow we get a better mixture of heated air throughout the drum.

In the graph above, the red and pink curves are the two ET curves. The gray, retangular flags on the red ET curve indicate points where I increased fan speed in small increments while trying to avoid the flick after first crack (the flick is the big bump in the blue line within the yellow band). You can see that as fan speed is increased and power is decreased, the two ET measurements begin to converge.
The raw data shows that the spread starts at 5.9°F at 6:30 with the fan at 50% and eventually reduces to 3.3°F by 10:00 with the fan at 100%. By 10:45, the difference is only 2.6°F.
I should also note that by the 9:05-mark, the heating element’s power was at 50% and on my setup, that is low enough for the fan to be able to significantly affect ET. By 10:00, I had the power dropped to 20%. I’ve since stopped dropping the power so low in order to avoid the crash in the rate-of-rise (RoR), indicated by the blue line above. But I digress…
The converging temps illustrate the effect increased airflow has on reducing pockets of hot air in the drum. At a certain sweet-spot of air flow + heat application, you can increase the responsiveness of your roaster by getting heated air uniformly distributed throughout the drum. At 6:30, the air was hotter the higher it was in the roaster (warm air rises). Just remember that airflow has a dehydrating effect and can also remove heated air from the drum faster than the element is heating it.
See also: Roast Physics: Moisture and Airflow
As an aside, you can barely see that there is a background roast profile loaded—you can see the tips of the curves at the end of the roast where the previous roast was stretched longer at the end phase (often called the ‘roast development’ phase). This is one of the things I love about the HotTop with the HTRI micro-controller installed; repeatability becomes much easier!
Update, October 4, 2016: clarified heat application in addition to air flow management and added image of probe placement.
Value 4 Value
If you found this content useful, please consider supporting my work. I charge no set fee or price for providing this. You can help keep information like this openly accessible by matching the value you received in the content; value 4 value.Ko-fi / Bitcoin Wallet: 32SW9kcAsJdZvQKBazhLUZBSD9YS8DDqe8
