
Understanding a coffee roasting profile is one of the first skills a new operator should obtain and luckily, profiles are relatively easy to understand!
The phases of a roast
To help understand what’s going on inside the roaster as well as to communicate with other operators about our roasts, we break it down into three phases. Across the industry, it’s standard to talk about three phases but the names of the phases differ and are slowly evolving. The three phases are very commonly referred to as:
- The first phase (drying phase)
- The second phase (sometimes called the Maillard phase or the ramp)
- The third phase (sometimes called the roast development phase or RD)
Some have argued that we should just call them the first, second, and third phase for clarity and I would agree with that (Rao, 2014). Drying doesn’t just happen in the first phase and it isn’t the only phenomenon happening during the first phase. It could be argued that it isn’t even the most important thing we’re worried about at that point in the roast (momentum possibly being more important).
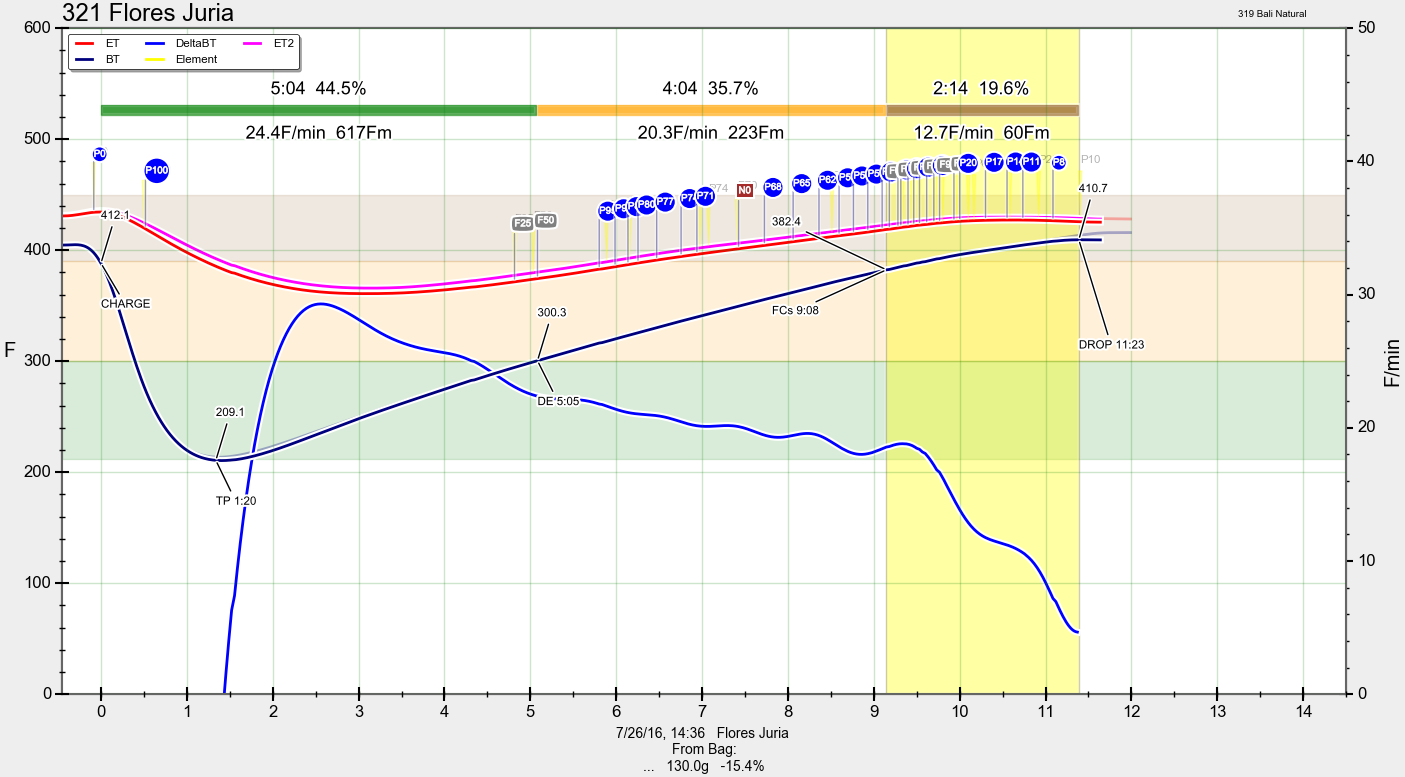
Most profiling software on the market, especially the more popular ones have the ability to visually distinquish the three phases. Artisan Roaster Scope is one of the more popular, free apps. Below is a screenshot from Artisan. The three horizontal, colored bands correlate to the three phases based on the bean temperature (BT), which is how we differentiate the phases. As the BT rises, we pass through different phases of the profile, which helps us to conceptualize what is happening inside the beans and that helps guide how we manipulate and control the machine.
Reading a profile
A roast profile is a graphical depiction of the roast progression, displayed as temperature over time. Temperature is typically recorded on the Y-axis and time is recorded on the X-axis. At a minimum the profile must display one measure of temperature, such as bean or environment temp, but can display as many as the machine can measure. In the profile above, I have displayed two disctinct readings of the environment temperature (ET and ET2) as well as BT and also the rate of change (RoC, labeled as ‘DeltaBT’ in the profile). I have a third ET measurement labeled as ‘Element’ that is too high in temp to be displayed on these graphs (read about the placement of this thermocouple here). In the top-left corner of the profile is the legend, indicating which measurements are of which color.
In this profile, the third phase is highlighted by the yellow, vertical band. This visualization method makes it easier to analyze the roast later, by clearly differentiating the third and final phase (sometimes called the roast development or RD phase). Additionally, all three phases are labeled by the colored bands across the top of the profile, along with the length of time of the phase, its percentage of the overall roast, and its Roc. The green band indicates the entire first phase; 5:04 in duration or 44.5% of the entire roast. The yellow band indicates the second phase; 4:04 in duration or 35.7% of the entire roast. The brown band indicates the third phase; 2:14 in duration or 19.6% of the entire roast.
Often a profile can indicate control changes made by the operator. In the image above, there are call-outs above the ET that indicate power changes (in blue circles) and fan changes (in gray boxes). These call-outs give us additional information for post-roast analysis by indicating what control changes the operator made at any given point. Optimally, we want these changes annotated automatically so that they are accurate and consistent. However, it is likely possible with a given profiling app to have manual buttons in the app that the operator can click to indicate various changes. These are certainly better than nothing, but the operator has to ensure they click the buttons quickly and consistently to indicate changes for later analysis.
The first phase
In the profile pictured above, the first phase is indicated by the green bands. While the BT is in the green, horizontal band, the profile is in the first phase.
During the first phase—the drying phase—we aren’t really doing much roasting of coffee and that’s because there is a lot of water that needs to be boiled off first. Water is a heat sink because it has a high heat capacity; it takes a lot of energy to raise its temperature. Therefore a lot of the heat we’re applying before we reach the boiling point of water (100°C or 212°F) is used to raise the temperature of the water. The temperature of the beans is also increasing here, but not as effectively/efficiently as it would if the beans had 0% moisture. I often say that in the first phase of the profile, we roasters are glorified water-boilers.
But there’s something else important to concentrate on during the first phase; momentum. During this phase we have a good opportunity to make sure we set ourselves up for success later in the roast by ensuring that we have just enough momentum to achieve our goals for this roast. Too much momentum and we’ll lose control of the roast and it will proceed too quickly. With too little momentum, we risk stalling (flattened or dropping BT) and that can cause muted, flat, bakey, dull flavors.
How do we know if our momentum is appropriate? We have consistent benchmarks throughout the roast that we use to guage our momentum. For example, a good first benchmark to have is the boiling point of water; 100°C or 212°F measured at the BT. We want to hit that point in about 4.5 - 5 minutes, as a general rule. Knowing that, we can guage our progress at the 3-minute-mark and decide if we need to increase or decrease momentum in order to hit our mark on time. It’s important to know that in the earlier part of the roast, say before the midway point, it is much easier to slow things down than later in the roast. Later in the roast, especially after first-crack, there is much more heat energy available than in the early stages (Davis, 2009). Therefore the first phase is the best phase for decreasing momentum should we be roasting too fast. Just remember not to overcompensate here. The later we get in the roast the more difficult it is to make big changes to momentum.
For more about momentum, read How To: Avoid The Flick And Crash
The second phase
One of the key phenomenons that occurs readily during the second phase is the Maillard reaction, which is actually a complex of reactions. The Maillard reaction is important in not only coffee roasting, but for many other foods such as bread, meats, etc. The Maillard reaction is the primary source for the brown color in the beans, the toastiness of bread, the browning of meat, etc. This complex of reactions happens at room temperature, but very slowly. At roughly 149°C or 300°F the reactions kick into overdrive and happen readily and rapidly and therefore we consider that point to be the onset of the second phase or the Maillard phase.
See also: The Maillard Reaction: A Practical Guide
Depending on what our goal is for a given coffee, we may choose to change the momentum here. For example, if I’m roasting a Colombian coffee that I know has some good chocolately, caramelly, nutty flavors that I want to highlight, I may choose to slow down the momentum during the second phase. I do this because the predominant flavors of the Maillard reaction are chocolatey, caramelly, and nutty. Slowing down here is what produces what is typically called an “S” curve (with the “S” laid on its side).
In the profile pictured above, you can see the control changes I began to make around 5:45, shortly after the second phase began. I started decreasing the power slowly, thus decreasing the amount of heat energy I was adding to the system. I often do this, and for two reasons; 1) it stretches out the second phase, giving the Maillard reaction a bit more time to proceed and 2) it reduces the momentum before first crack. Looking at the RoC at the 9:00 mark, we can see the beginnings of what is called an exothermic flash, which happens when the beans release enough thermal energy to affect the environment temperature. If left unchecked, this could the added heat could accellerate our roasting process, giving us results we didn’t necessarily plan for or want.
For more on exothermic flashes, read How To: Avoid The Flick And Crash
The third phase
The third phase is often called the roast development phase but we’re actually developing the roast the whole time, so it’s a misnomer, but one that has stuck. By the time we reach the third phase, we have built up a lot of momentum and there is a lot of heat energy available to do work—heat provides energy to fuel chemical reactions.
A lot is going on by the time we hit ~390°F, ~200°C. By now we have build up a large amount of pressure inside the beans, mostly from vaporizing water and forming CO2 via chemical reactions. The heat has also been weakening the cell walls, making the bean first pliable and eventually brittle. As the pressure continues to build and the cell walls weaken, the walls begin to stretch and the bean begins to enlarge. It is not uncommon for it to nearly double in size.
The third step in the Maillard reaction is the formation of melanoidins and also the caramelization of sugars. We get a visual cue of both of these; they produce the brown color we associate with roasted beans. The darker the brown, the more carbony, ashy, and bittersweet flavors we produce. The third step of the Maillard reaction happens around the time we transition into the third phase of the roast and browning of the beans is a visual cue of our change in roasting phases (this is covered in the SCA Roasting Intermediate course).
See also: The Maillard Reaction: A Practical Guide
Here again we have an opportunity to reflect on our goals for the roast and react accordingly. If our goal is a darker roast with more of the flavors that fall under the ‘roasted’ category of the flavor wheel such as burnt, smoky, tobacco, etc, we can stretch this phase out a bit. If our goal is a lighter roast with fewer of those flavors and more floral and fruity flavors, then we need to cut this phase shorter.
Summary
Conceptualizing our entire roasting process as three distinct phases helps us to simplify a complex process and also gives us benchmarks along the way to help ensure we are on track or can get on track to end with a successful roast. Though the three phases can be called different things by different people, we all basically agree on their underlying definition. Our roast profiles are recipes that can be reproduced in the future with the same coffee and they also allow us to analyze our roasting procedures and make informed changes to improve our craft. For these reasons it is critical for beginner roasters to master the skill of reading and analyzing roast profiles.
- Rao, S. (2014). The Coffee Roaster’s Companion. Scott Rao; 1st edition (2014).
- Davis, T. (2009). The Heat Is On. Roast Magazine.
Value 4 Value
If you found this content useful, please consider supporting my work. I charge no set fee or price for providing this. You can help keep information like this openly accessible by matching the value you received in the content; value 4 value.Ko-fi / Bitcoin Wallet: 32SW9kcAsJdZvQKBazhLUZBSD9YS8DDqe8